
RELEVANT FINANCIAL DATA, GRUPO CARSO 2023
| (Amounts in thousands of pesos, except for income per share) | 2021 | 2022 | 2023 | Var % 2023 - 2022 |
|---|---|---|---|---|
|
Sales |
124,572,789 |
181,538,678 |
198,455,309 |
9.3% |
|
Gross income |
30,624,023 |
44,359,946 |
52,428,493 |
18.2% |
|
Operating income |
12,856,985 |
25,965,096 |
24,393,399 |
-6.1% |
|
EBITDA |
15,723,702 |
27,478,334 |
30,930,224 |
12.6% |
|
Controlling intererest in the net income |
11,282,039 |
19,061,904 |
13,519,384 |
-29.1% |
|
Income per share (UPA)* |
4.98 |
4.98 |
6.00 |
-29,1% |
|
MARGINS |
||||
|
Gross |
24.6% |
24.4% |
26.4% |
2.0 pp
|
|
Operational |
10.3% |
14.3% |
12.3% |
-2.0 pp |
|
EBITDA |
12.6% |
15.1% |
15.6% |
0.4 pp |
|
Net |
9.1% |
10.5% |
6.8% |
-3.7 pp |
|
SALES |
||||
|
Commercial
|
52,939,371 |
69,745,699 |
73,326,668 |
13.1% |
|
Industrial |
44,259,032 |
49,599,601 |
44,599,601 |
-10.0% |
|
Infraestructure and Construction |
25,472,323 |
38,813,412 |
45,009,965 |
16.0% |
|
Elementia / Fortaleza |
32,238,955 |
36,310,278 |
32,261,5836,168,958 |
-11.2% |
|
Energy |
2,994,411 |
4,114,856 |
4,114,856 |
-15.5% |
|
EBITDA** |
||||
|
Commercial |
4,724,106 |
7,124,285 |
7,110,926 |
-0.2% |
|
Industrial |
6,026,669 |
6,850,756 |
5,842,446 |
-14.7% |
|
Infraestructure and Construction |
1,828,355 |
4,887,478 |
7,451,680 |
52.5% |
|
Elementia / Fortaleza |
5,591,636 |
5,770,591 |
6,168,958 |
6.9% |
|
Energy |
2,280,280 |
3,378,834 |
3,007,109 |
-11.0% |
|
EBITDA MARGIN |
||||
|
Commercial |
8.9% |
11.0% |
9.7% |
-1.3 pp |
|
Industrial |
13.6% |
13.8% |
13.1% |
-0.7 pp |
|
Infraestructure and Construction |
7.2% |
12.6% |
16.6% |
4.0 pp |
|
Elementia / Fortaleza |
17.3% |
16.6% |
19.1% |
3.2 pp |
|
Energy |
76.2% |
82.1% |
86.5% |
4.4 pp |
|
Total assets |
185,773,253 |
239,382,102 |
250,473,788 |
4.6% |
|
Total liabilities |
71,698,6 |
104,527,859 |
106,318,044 |
1.7% |
|
Book Capital |
14,074,647 |
134,854,243 |
144,155,720 |
6.9% |
|
Weighted average of outstanding shares (´000)
|
2,267,648 |
2,251,633 |
2,252,660 |
0.05% |
*UPA: Calculated as a controlling interest in the net income from the weighted average of outstanding shares. Amounts in pesos
** EBITDA: Earnings before interest, taxes, depreciation and amortization. Expenses from interest, deterioration of machinery and equipment, exploration expenses and the effects of derivate financial instruments, minus income from interest, net exchange gains, surplus from commercial malls and from participation in the results of associated companies and joint enterprises. See the coinciliation in Note 32 of the Financial Statement. pp: Variation in percentage points
RELEVANT FINANCIAL DATA
Participation in Sales by
Subsidiaries (in millions of pesos)
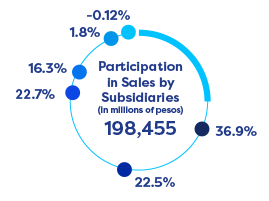
73,327
Commercial and Consumption
44,620
Industrial and Manufacturing
45,010
Infrastructure and Construction
32,262
Elementia / Fortaleza
3,477
Energy
-239
Others
Participation in Operating Income per
Subsidiary
(in millions of pesos
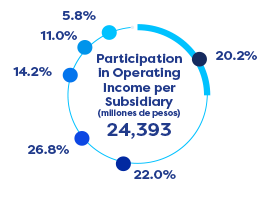
4,938
Commercial and Consumption
5,366
Industrial and Manufacturing
6,544
Infrastructure and Construction
3,467
Elementia / Fortaleza
2,674
Energy
1,405
Others

Sales (in millions of pesos)
2021
124,573
2022
181,539
2023
198,455
Operating income (millions of pesos)
2021
12,857
2022
25,965
2023
24,393
EBITDA* (millions of pesos)
2021
15,724
2022
27,478
2023
30,930
*Note: In the EBITDA data for the 2023 fiscal year, the amounts of $1,753,037 of interest income, $170,601 for surplus value in the appraisal of commercial malls, and $1,639 in expenditures for environmental restoration have been excluded. See the conciliation of the EBITDA in Note 32 of the Financial Statement. The Elementia/Fortaleza numbers were consolidated beginning in May of 2022.